
- สร้างโปรเจ็กส์
- Install Angular 2 Charts and Charts.js
- Show Line Charts
- Create Bar Charts
- Create Doughnut Chart
1. สร้างโปรเจ็กส์
[code]
ionic start ionic-charts blank
[/code]
รันโปรเจ็กส์
[code]
cd ionic-charts
ionic serve
[/code]
2. Install Angular 2 Charts and Charts.js
[code]
npm install ng2-charts –save
npm install chart.js –save
[/code]
src/app/app.module.ts
|
1 2 3 4 5 6 7 8 9 10 11 12 13 14 15 16 17 18 19 20 21 22 23 24 25 26 27 28 29 30 31 32 |
import { BrowserModule } from '@angular/platform-browser'; import { ErrorHandler, NgModule } from '@angular/core'; import { IonicApp, IonicErrorHandler, IonicModule } from 'ionic-angular'; import { SplashScreen } from '@ionic-native/splash-screen'; import { StatusBar } from '@ionic-native/status-bar'; import { ChartsModule } from 'ng2-charts'; import { MyApp } from './app.component'; import { HomePage } from '../pages/home/home'; @NgModule({ declarations: [ MyApp, HomePage ], imports: [ BrowserModule, IonicModule.forRoot(MyApp), ChartsModule ], bootstrap: [IonicApp], entryComponents: [ MyApp, HomePage ], providers: [ StatusBar, SplashScreen, { provide: ErrorHandler, useClass: IonicErrorHandler } ] }) export class AppModule { } |
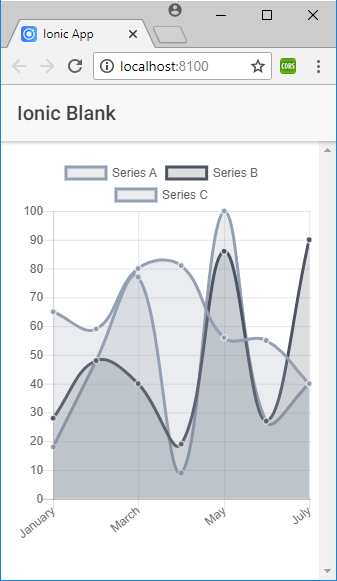
3. Show Line Charts
src/pages/home/home.html
|
1 2 3 4 5 6 7 8 9 10 11 12 13 14 15 16 17 18 19 |
<ion-header> <ion-navbar> <ion-title> Ionic Blank </ion-title> </ion-navbar> </ion-header> <ion-content padding> <div class="row"> <div class="col-md-6"> <div style="display: block;"> <canvas baseChart width="300" height="400" [datasets]="lineChartData" [labels]="lineChartLabels" [options]="lineChartOptions" [colors]="lineChartColors" [legend]="lineChartLegend" [chartType]="lineChartType" (chartHover)="chartHovered($event)" (chartClick)="chartClicked($event)"></canvas> </div> </div> </div> </ion-content> |
src/pages/home/home.ts
|
1 2 3 4 5 6 7 8 9 10 11 12 13 14 15 16 17 18 19 20 21 22 23 24 25 26 27 28 29 30 31 32 33 34 35 36 37 38 39 40 41 42 43 44 45 46 47 48 49 50 51 52 53 54 55 56 57 58 59 60 61 62 63 64 65 66 67 68 69 70 71 |
import { Component } from '@angular/core'; import { NavController } from 'ionic-angular'; @Component({ selector: 'page-home', templateUrl: 'home.html' }) export class HomePage { public lineChartData: Array<any> = [ { data: [65, 59, 80, 81, 56, 55, 40], label: 'Series A' }, { data: [28, 48, 40, 19, 86, 27, 90], label: 'Series B' }, { data: [18, 48, 77, 9, 100, 27, 40], label: 'Series C' } ]; public lineChartLabels: Array<any> = ['January', 'February', 'March', 'April', 'May', 'June', 'July']; public lineChartOptions: any = { responsive: true }; public lineChartColors: Array<any> = [ { // grey backgroundColor: 'rgba(148,159,177,0.2)', borderColor: 'rgba(148,159,177,1)', pointBackgroundColor: 'rgba(148,159,177,1)', pointBorderColor: '#fff', pointHoverBackgroundColor: '#fff', pointHoverBorderColor: 'rgba(148,159,177,0.8)' }, { // dark grey backgroundColor: 'rgba(77,83,96,0.2)', borderColor: 'rgba(77,83,96,1)', pointBackgroundColor: 'rgba(77,83,96,1)', pointBorderColor: '#fff', pointHoverBackgroundColor: '#fff', pointHoverBorderColor: 'rgba(77,83,96,1)' }, { // grey backgroundColor: 'rgba(148,159,177,0.2)', borderColor: 'rgba(148,159,177,1)', pointBackgroundColor: 'rgba(148,159,177,1)', pointBorderColor: '#fff', pointHoverBackgroundColor: '#fff', pointHoverBorderColor: 'rgba(148,159,177,0.8)' } ]; public lineChartLegend: boolean = true; public lineChartType: string = 'line'; public randomize(): void { let _lineChartData: Array<any> = new Array(this.lineChartData.length); for (let i = 0; i < this.lineChartData.length; i++) { _lineChartData[i] = { data: new Array(this.lineChartData[i].data.length), label: this.lineChartData[i].label }; for (let j = 0; j < this.lineChartData[i].data.length; j++) { _lineChartData[i].data[j] = Math.floor((Math.random() * 100) + 1); } } this.lineChartData = _lineChartData; } // events public chartClicked(e: any): void { console.log(e); } public chartHovered(e: any): void { console.log(e); } constructor(public navCtrl: NavController) { } } |
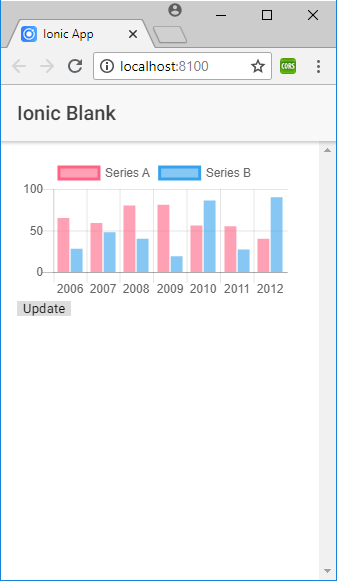
4. Create Bar Charts
src/pages/about/about.html
|
1 2 3 4 5 6 7 8 9 10 11 12 13 14 15 |
<ion-header> <ion-navbar> <ion-title> Ionic Blank </ion-title> </ion-navbar> </ion-header> <ion-content padding> <div style="display: block"> <canvas baseChart [datasets]="barChartData" [labels]="barChartLabels" [options]="barChartOptions" [legend]="barChartLegend" [chartType]="barChartType" (chartHover)="chartHovered($event)" (chartClick)="chartClicked($event)"></canvas> </div> <button (click)="randomize()">Update</button> </ion-content> |
src/pages/about/about.ts
|
1 2 3 4 5 6 7 8 9 10 11 12 13 14 15 16 17 18 19 20 21 22 23 24 25 26 27 28 29 30 31 32 33 34 35 36 37 38 39 40 41 42 43 44 45 46 47 48 49 50 51 52 53 54 55 56 |
import { Component } from '@angular/core'; import { NavController } from 'ionic-angular'; @Component({ selector: 'page-home', templateUrl: 'home.html' }) export class HomePage { public barChartOptions: any = { scaleShowVerticalLines: false, responsive: true }; public barChartLabels: string[] = ['2006', '2007', '2008', '2009', '2010', '2011', '2012']; public barChartType: string = 'bar'; public barChartLegend: boolean = true; public barChartData: any[] = [ { data: [65, 59, 80, 81, 56, 55, 40], label: 'Series A' }, { data: [28, 48, 40, 19, 86, 27, 90], label: 'Series B' } ]; // events public chartClicked(e: any): void { console.log(e); } public chartHovered(e: any): void { console.log(e); } public randomize(): void { // Only Change 3 values let data = [ Math.round(Math.random() * 100), 59, 80, (Math.random() * 100), 56, (Math.random() * 100), 40]; let clone = JSON.parse(JSON.stringify(this.barChartData)); clone[0].data = data; this.barChartData = clone; /** * (My guess), for Angular to recognize the change in the dataset * it has to change the dataset variable directly, * so one way around it, is to clone the data, change it and then * assign it; */ } constructor(public navCtrl: NavController) { } } |
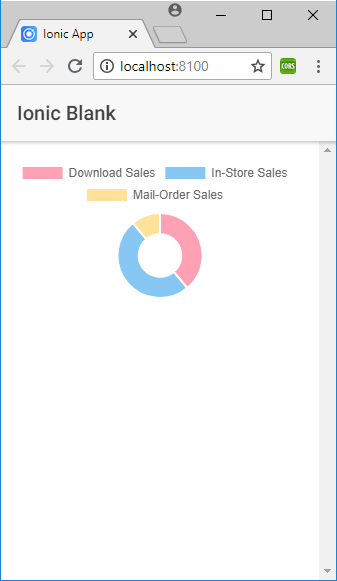
5. Create Doughnut Chart
src/pages/contact/contact.html
|
1 2 3 4 5 6 7 8 9 10 11 12 13 14 |
<ion-header> <ion-navbar> <ion-title> Ionic Blank </ion-title> </ion-navbar> </ion-header> <ion-content padding> <div style="display: block"> <canvas baseChart [data]="doughnutChartData" [labels]="doughnutChartLabels" [chartType]="doughnutChartType" (chartHover)="chartHovered($event)" (chartClick)="chartClicked($event)"></canvas> </div> </ion-content> |
src/pages/contact/contact.ts
|
1 2 3 4 5 6 7 8 9 10 11 12 13 14 15 16 17 18 19 20 21 22 23 24 25 26 27 |
import { Component } from '@angular/core'; import { NavController } from 'ionic-angular'; @Component({ selector: 'page-home', templateUrl: 'home.html' }) export class HomePage { // Doughnut public doughnutChartLabels: string[] = ['Download Sales', 'In-Store Sales', 'Mail-Order Sales']; public doughnutChartData: number[] = [350, 450, 100]; public doughnutChartType: string = 'doughnut'; // events public chartClicked(e: any): void { console.log(e); } public chartHovered(e: any): void { console.log(e); } constructor(public navCtrl: NavController) { } } |
Link